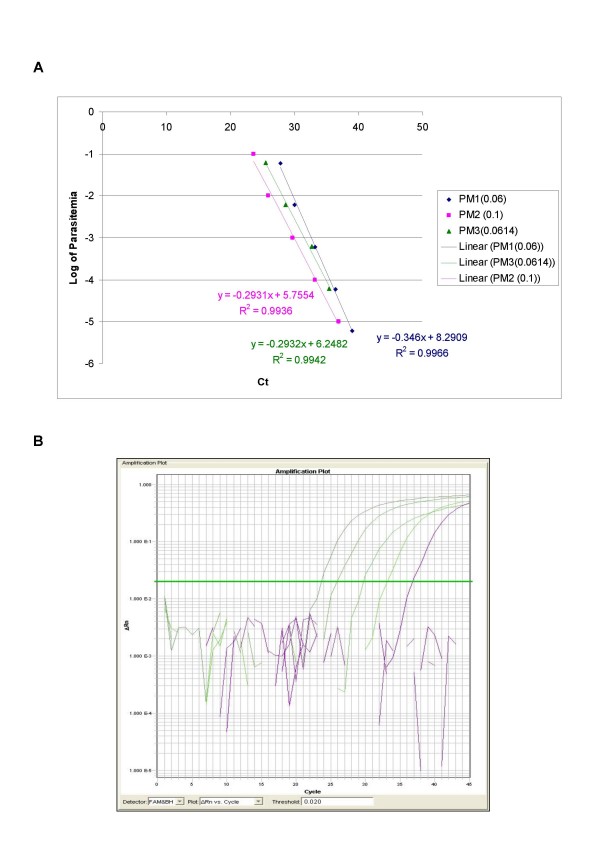
Figure 3.
A plot of log of parasitaemia versus threshold cycle for the 10-fold serial dilutions of P. malariae (A) and a representative amplification plot for 10-fold serial dilutions (B) generated by QPCR are also shown. All clinical isolates were amplified in triplicate for each species with the linear correlation coefficient (R2) shown in the corresponding color.

