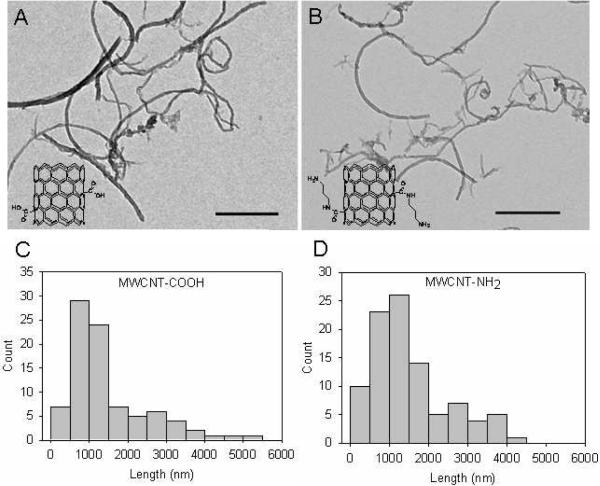
Figure 1.
Characterization of MWCNT-COOH and MWCNT-NH2 by TEM. Upper panel: TEM images of MWCNT-COOH (A) and MWCNT-NH2 (B). Scale bars indicate 500 nm. Insets: chemical structures of MWCNTs. Lower panels: length distributions of MWCNT-COOH (C) and MWCNT-NH2 (D) in H2O after 5 minutes sonication. Each histogram was generated based on counting ~100 nanotubes.

