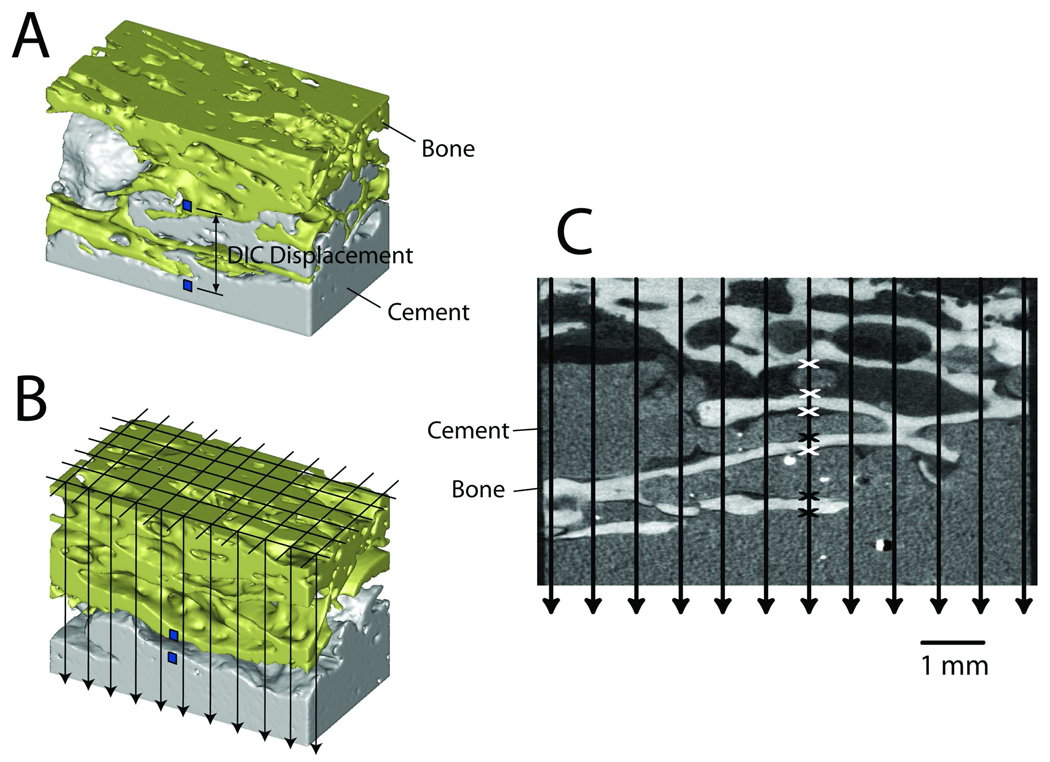
Figure 3.
MicroCT scans were created of each specimen prior to mechanical loading (A). The small squares placed on image A and B indicate location of digital image correlation (DIC) measurement locations at the cement-bone interface. The relative vertical displacement between the two squares was used as the measure of interface micromotion. A grid was constructed and projected vertically through the image sets (B) and stereology was used to quantify the contact fraction and intersection fraction at the cement-bone interface (C). Points of apposition (black x) and points of proximity (white x) are shown for one of the projection lines.

