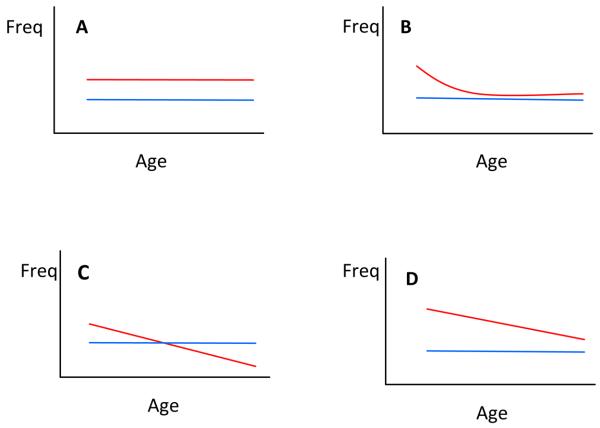
Figure 1. Hypothetical MAP Models of Association with Risk and Age at Onset.
Plots depict marker frequency distribution as a function of age in controls (blue) vs. patients (red). If marker is not associated with disease, the curves for patients and controls would be superimposed (not shown, for an example with real data see Figure 3). Model A depicts a susceptibility allele for which marker frequency is elevated in patients uniformly across all ages. Model B depicts an age-varying association where the marker is associated only with early-onset form of disease. Model C depicts an age at onset modifier, where there is no difference in the overall average marker frequency between patients and controls, but there is a shift in patients showing higher frequencies of the marker in younger onset cases and subsequent depletion of that marker towards later onsets. Model D depicts a marker that is associated with both risk (as evidenced by higher frequency in patients vs. controls) and age at onset (as evidenced by the shift in patients).

