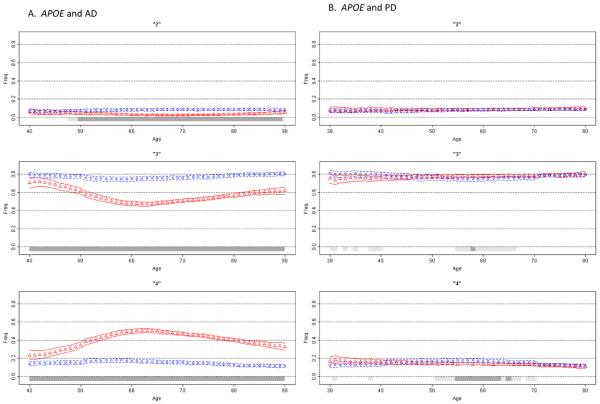
Figure 2. Association of APOE with Alzheimer's Disease and Parkinson's Disease.
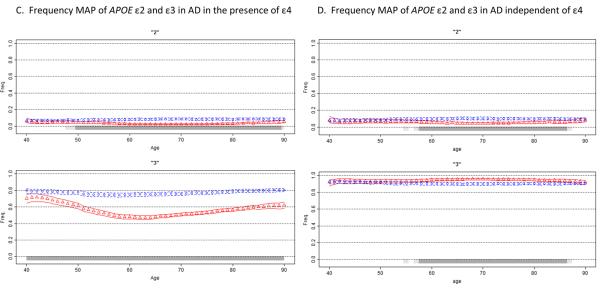
Moving average frequency estimates of the three APOE alleles (ε2 top, ε3 middle, ε4 bottom panel) are plotted against age for controls (blue circles) and age at onset for patients (red triangles), each shown with 95% CPI. Due to few subjects in the extreme low and high ages, tail ends were collapsed (ages ≤30 and ≥80 for PD, ≤40 and ≥90 for AD). A gray bar indicates the allele frequency is significantly different in cases than in controls under a two-sided comparison, not adjusted for multiple comparisons: light gray for at least 95% posterior probability, dark gray for at least 99% probability. Figure 2A shows that ε4 frequency in AD patients begins a sharp rise after age 40, reaches its peak at around age 60, and then starts to decline, while remaining above the control frequency at all ages. For PD (Figure 2B), the effect is dramatically different (for enlarged figure, see the supplemental material). The MAP of ε4 in PD patients is sloped and intersects with control MAP. ε4 is enriched in the youngest patients and depleted in the oldest patients; a pattern suggestive of an age at onset effect. Figures 2C and 2D depict frequency MAPs of ε2 and ε3, before and after the ε4 effect is removed. The plots demonstrate that the reduced frequency of ε2 in AD patients is independent of ε4, but the lower frequency of ε3 in patients is solely due to the increased frequency of ε4 and disappears once the ε4 effect is removed. In the absence of ε4, ε3 frequency in patients is elevated because the frequency of ε2 is decreased.


