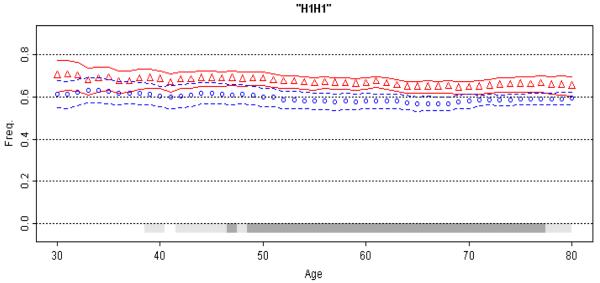
Figure 4. Association of MAPT with Parkinson's Disease.
Moving average frequency of the H1H1 diplotype is plotted against age for controls (blue circles) and age at onset for patients (red triangles), each shown with 95% CPI (grey bars, light gray for at least 95% posterior probability, dark gray for at least 99% probability). The extreme low (≤30 yrs.) and high (≥80 yrs.) ages were collapsed. The MAP for patients is consistently above the MAP for controls, suggestion a uniform association that achieves highest statistical significance in the 50-70 year age spectrum (for enlarged figure, see the supplement).

