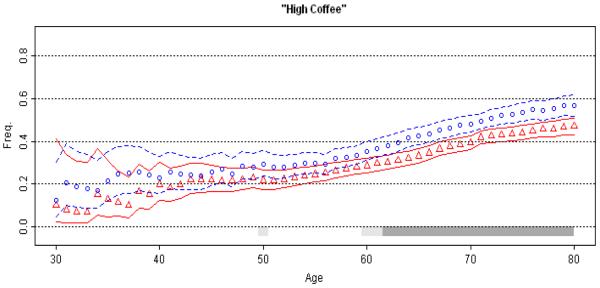
Figure 5. Association of Coffee with Parkinson's Disease.
Moving average estimates of amount of coffee consumed is plotted against age at data collection (patients: red circles, controls: blue triangles), with 95% CPI (grey bar). The extreme low (≤30 yrs.) and high (≥80 yrs.) ages were collapsed. Subjects were classified as high or low coffee consumers if their total lifetime consumption of caffeinated coffee was less or more than the median coffee consumption in controls (the median was 66, which was calculated as the number of caffeinated coffee cups an individual drank per day multiplied by the number of years of consumption). The age scale indirectly reflects cumulative intake of coffee over the years. The upward slopes of MAPs reflect increasing cumulative coffee consumption with advancing age in both cases and controls. Age and age at onset are highly correlated. If one uses cases only to assess marker association with age at onset, one will obtain highly significant, but inaccurate, evidence for association coffee with delayed onset.

