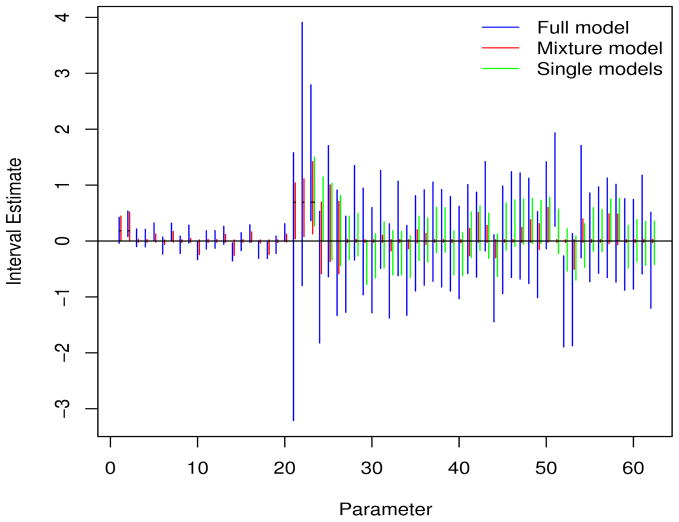
Figure 3.
Summaries of three modeling approaches for simulation 9. Parameters 1–20 represent SNP main effects, 21–22 are the exposure main effects, and 23–62 are the 40 interactions. The latter are ordered so that 23 and 24 correspond to the interaction between SNP 1 and exposures 1 and 2, respectively, etc. The five short horizontal lines represent the true effect sizes.

