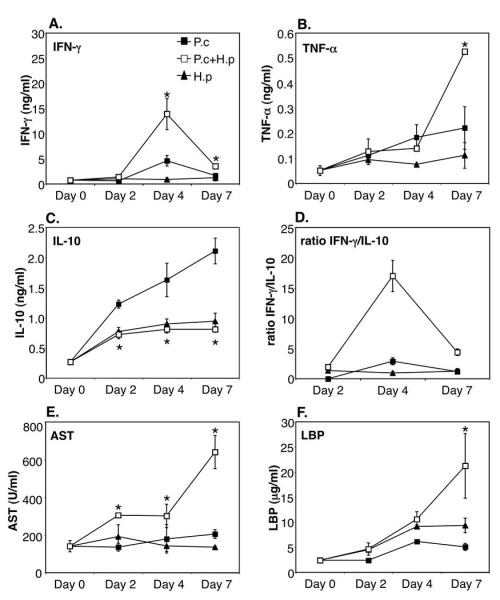
FIGURE 4. Increased levels of serum cytokines, LBP and liver enzyme during malaria/helminth co-infection.
C57Bl/6 mice were infected orally as above. Serum levels of IFN-γ (A), TNF-α (B), IL-10 (C) and LBP (F) were measured by sandwich ELISA and AST (E) by colorimetric assay. Mean of 4-8 mice per group and SEM are shown. Data from one representative experiment out of three is shown. Asterisks indicate statistically significant difference between groups of mice with P. chabaudi or P. chabaudi plus H. polygyrus infection (P<0.05).

