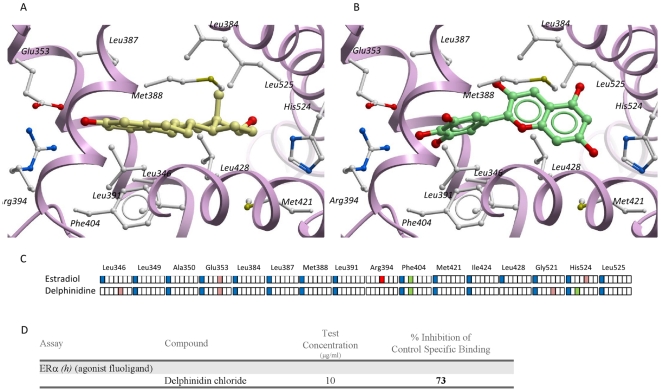
Figure 4. Binding assay and docking show direct interaction between delphinidin and ERα activator site.
Binding mode of 17-β estradiol (E2) (panel A, X-ray structure) and delphinidin (panel B, docking model) to the ligand-binding domain of the ERα (1a52 PDB entry). The receptor backbone is displayed by solid ribbons. Ligand-contacting side chains are displayed by white ball and sticks. Carbon atoms of receptor-bound E2 and delphinidin are in yellow and green, respectively. In panel C, the ligand-receptor interactions for both compounds are encoded by an interaction fingerprint converting into a 7 bit string the interaction of the ligand with each residue of the binding site using the following color-coding: blue, apolar contact; green: aromatic interaction; red: hydrogen-bond. Eventually, D represents results of a binding assay of delphinidin on ERα. E2 was used as control agonist for ERα and delphinidin was used at concentration exerting endothelial effects shown before (10−2 g/L).

