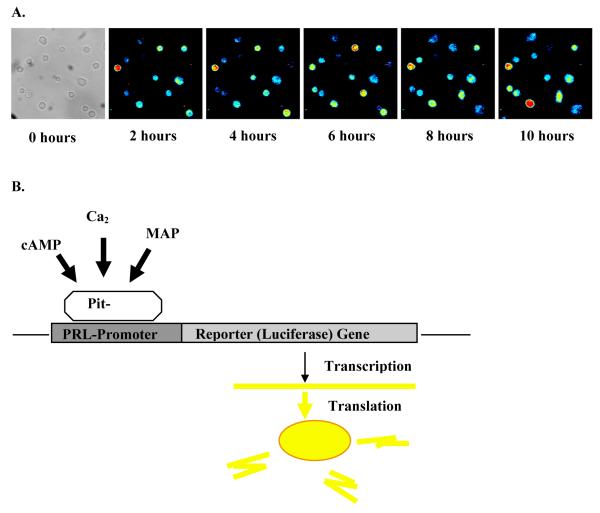
Figure 2.
Live cell luminescence microscopy. A) Tracking human prolactin transcription over time following stimulation with 5 μM forskolin. Time lapse microscopy images of GH3 cells, transfected with a 13kd human prolactin promoter luciferase reporter construct. B) Diagramatic representation of live cell luminescence microscopy. Activation of prolactin is visualised as light production resulting from the transcription of the reporter (luciferase) gene.

