Figure 5.
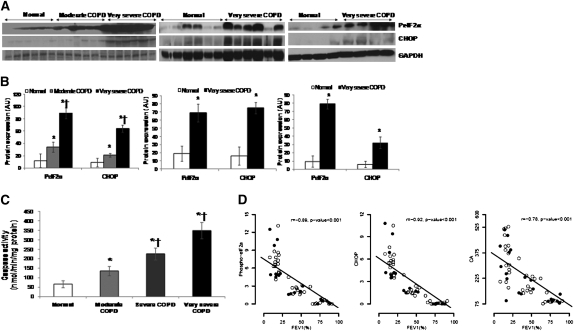
Markers of endoplasmic reticulum (ER) stress in the peripheral lung tissue of patients with chronic obstructive pulmonary disease (COPD) and normal control subjects. (A) Immunoblot analysis of phosphorylated-eIF2α and cytosine-cytosine-adenine-adenine-thymine enhancer-binding protein homologous protein (CHOP) in lung lysates from normal subjects (n = 17) and patients with moderate (n = 12), severe (n = 12), and very severe COPD (n = 24). Glyceraldehyde phosphate dehydrogenase (GAPDH) was loading control Immunoblot on the left consists of smoker normal, smoker moderate COPD, and smoker very severe COPD (n = 6/phenotype). Immunoblot in the center consists of six normal (nonsmokers [n = 3], ex-smoker [n = 1], and current smoker [n = 2]) and six very severe COPD lungs (ex-smokers [n = 4] and current smokers [n = 2]). Immunoblot on the right consists of four normal (nonsmokers [n = 2], ex-smoker [n = 1], current smoker [n = 1]) and four very severe COPD (ex-smokers [n = 2] and current smokers [n = 2]). (B) Densitometric analysis of immunoblot normalized to GAPDH using ImageJ software. Data represent mean ± SD of arbitrary units. *Significant when compared with normal control subjects, and †significant when compared with moderate COPD as analyzed by one-way analysis of variance (ANOVA), P < 0.001. (C) Caspase activity in the peripheral lung tissue of normal subjects (n = 17) and patients with moderate (n = 12), severe (n = 12), and very severe COPD (n = 24). Caspase activity measured in total lung lysates by Apo-ONE Caspase-3/7 assay. Data represent mean ± SD (nmol/min/mg protein). *Significant when compared with normal control subjects, and †significant when compared with moderate COPD as analyzed by one-way ANOVA, P < 0.001. (D) Spearman correlation analysis showed a significant correlation between lung function (FEV1%) and ER stress markers, phosphorylated-eukaryotic translation initiation factor 2α and CHOP proteins and caspase activity colored based on smoking status. Open circles represent ex-smokers and solid circles represent current smokers. The line represents the dose–response relationship based on simple linear models on FEV1% versus log2 proteasomal activity. r = Spearman correlation coefficient.

