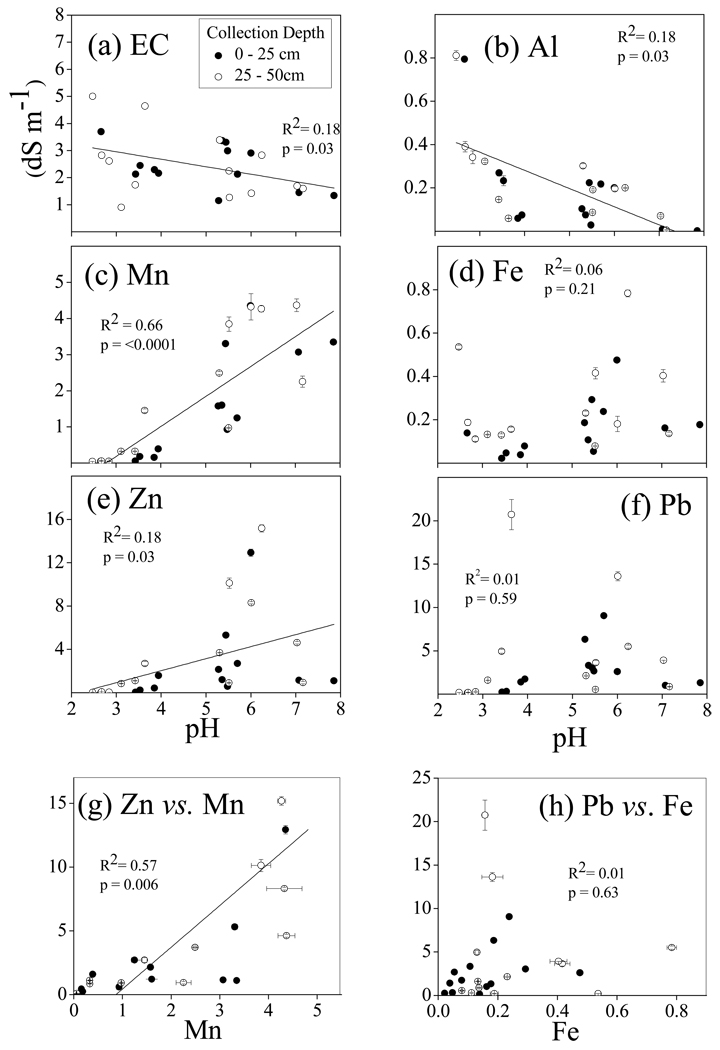
Figure 2.
Aqueous phase electrical conductivity (EC) and DTPA extractable metals from initial surface and subsurface sampling of tailings. (a) EC (in units of dS m−1) versus tailings pH. In parts (b–f) DTPA extractable concentrations of various metals are plotted in units of grams of metal extracted/kg of tailings dry mass (g kg−1), but note that each is plotted on its own Y axis scale versus a consistent X axis pH scale: (b) Al, (c) Mn, (d) Fe, (e) Zn, (f) Pb. Bottom two graphs show (g) Zn versus Mn, and (h) Pb versus Fe correlations in DTPA extracts (all in units of g kg−1). Linear regression statistics are shown on each plot, but lines are shown only in cases where linear fits were statistically significant (p < 0.05).

