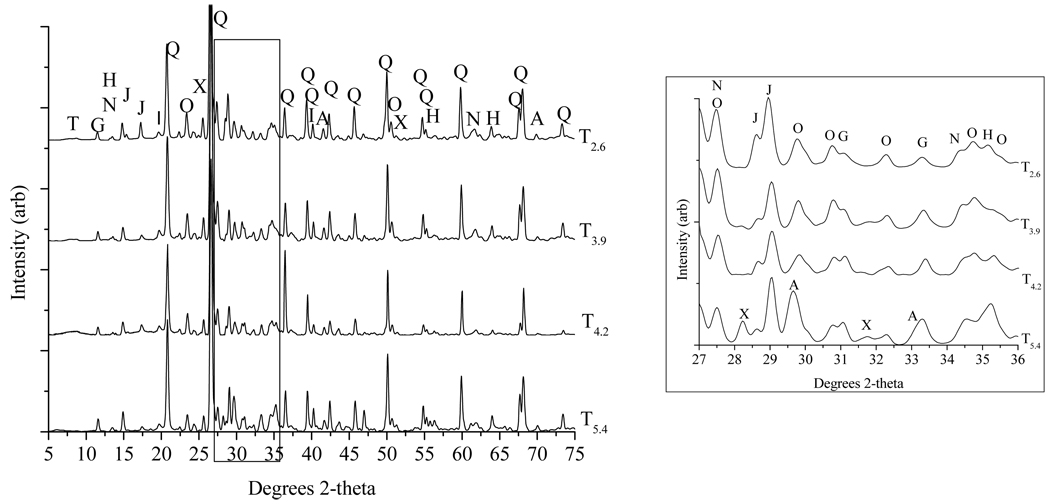
Figure 3.
X-ray powder diffraction patterns of tailings samples (< 2 mm fraction). Left side is full diffraction pattern, whereas right side shows expanded portion for 27–36 °2θ, which contains peaks corresponding to key silicate and sulfate phases. Phases identified, in order of relative abundance: quartz (Q), orthoclase (O), jarosite (J), gypsum (G), hedenbergite (H), johannsenite (N), Zn-talc (T), axinite (X), and andradite (A).

