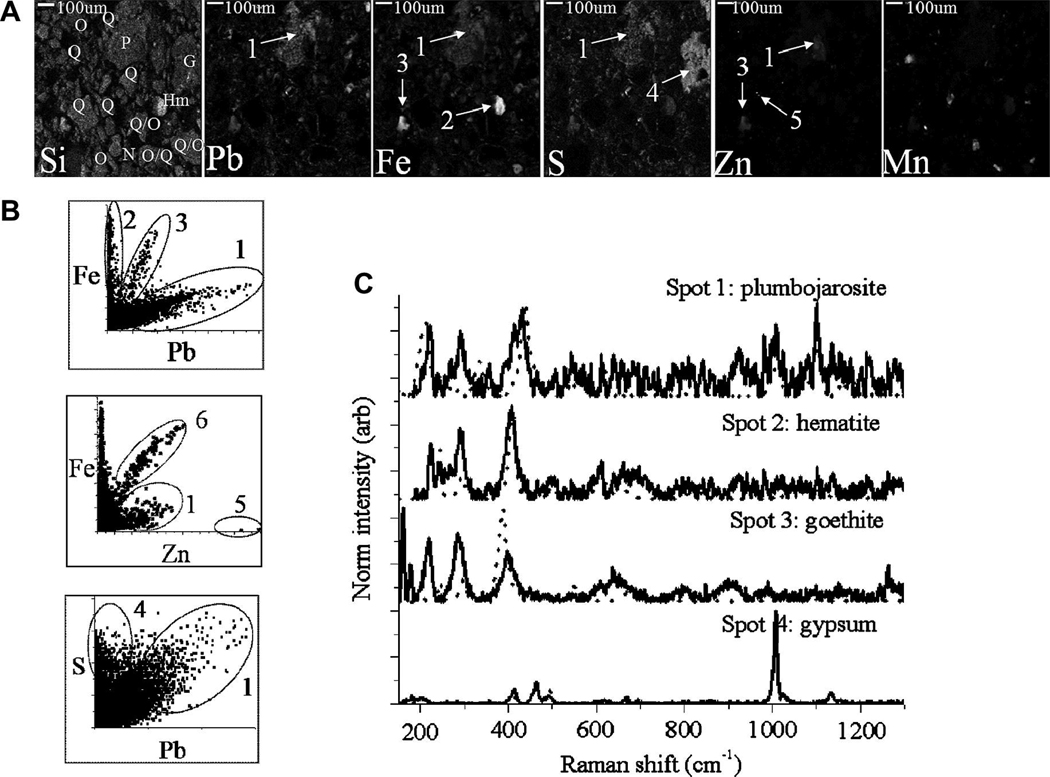
Figure 7.
Lead and Zn containing phases in T2.6. (A) XRF map (see Table 2 for abbreviations of mineral in Si map), (B) Pb-Fe and Pb-S correlation plots from the XRF map, (C) Micro-Raman spectra showing grain-scale mineral phase identification (spectra shown in solid lines and RRUFF references shown in dotted lines).

