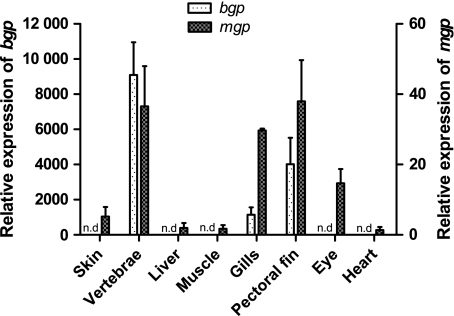
Fig. 2.
Relative gene expression of bgp (left y-axis) and mgp (right y-axis) in different tissues of juvenile Atlantic salmon (S. salar L). The x-axis presents the tissues used, whereas the two y-axes show the relative abundance of transcripts in relation to the reference gene (ef1α). n.d, not detectable. Data are given as mean + SE, n = 3.

