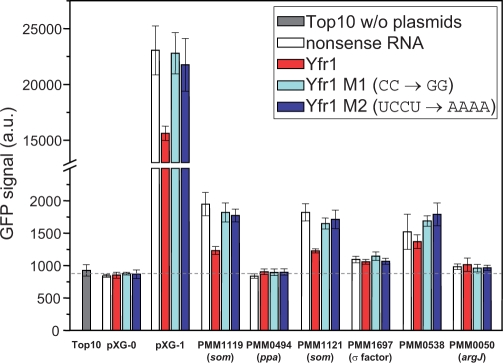
Fig. 3.
Experimental validation of Yfr1 target predictions. The relative decrease in GFP fluorescence as determined by flow cytometry indicates the strength of Yfr1-mediated regulation. The dashed line indicates background fluorescence (i.e. cellular autofluorescence), determined as the mean GFP signal of the negative controls. Fold changes of reduced GFP signal for PMM1119 (3.0-fold), PMM1121 (2.7-fold) and pXG1 (1.5-fold) were calculated after background subtraction from absolute fluorescence values (Urban and Vogel, 2007).

