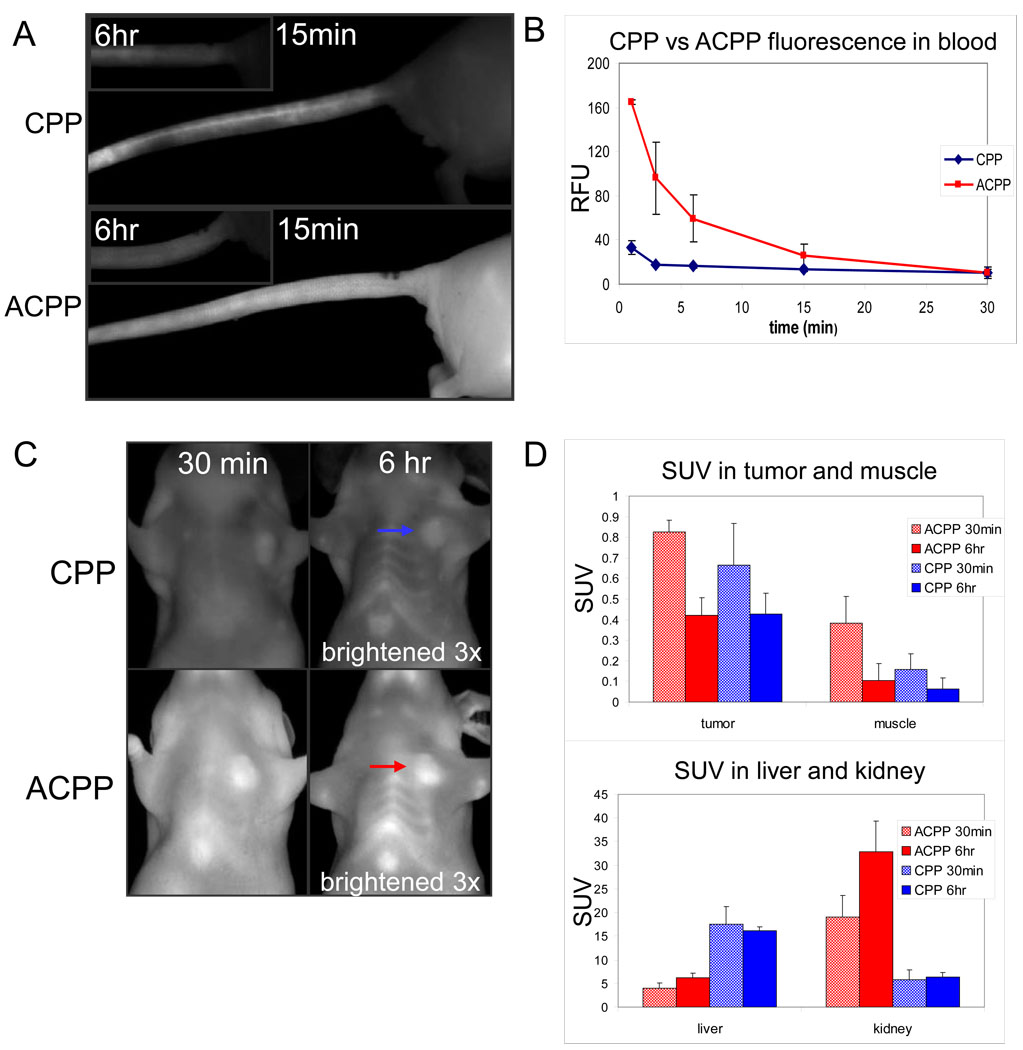
Fig. 3.
Comparison of pharmacokinetic tissue distribution between CPP and ACPP following intravenous injection into HT-1080 tumor bearing nude mice reveals differences in peptide distribution. (A) Images showing tail veins of animals injected with CPP (top) and ACPP (bottom) at the indicated time points following injection. (B) Cy5 fluorescence in the blood throughout the first 30 minutes after injection as an average of three mice for CPP and ACPP. Tumors are indicated by arrows. (C) Representative HT-1080 mice injected with CPP and ACPP were imaged at 30 minutes and 6 hours (6 hour images brightened 3x). (D) Standardized uptake value (SUV, moles/g in tissue / moles injected/weight of animal) of peptide in tumor, muscle, liver, and kidney, showing changes over time between ACPP and CPP injection. (n=4 for all 6 hour mice, n=5 for all organs of 30 minute mice, n=4 and n=3 for ACPP and CPP tumors of 30 minute mice).

