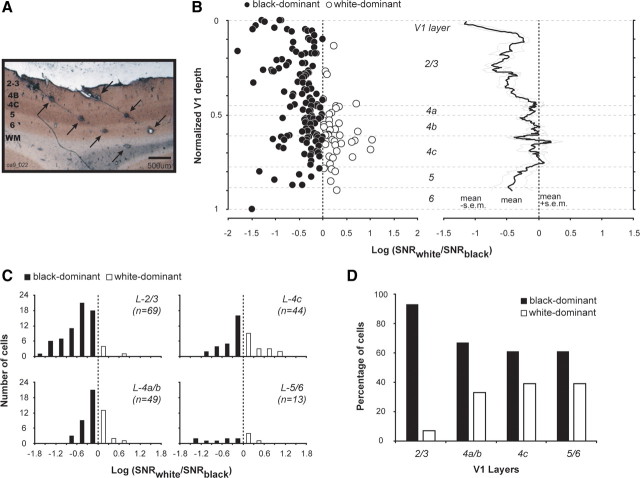
Figure 2.
Neurons in layers 2/3 of V1 respond more to black than to white stimuli. A, A 50 μm cytochrome oxidase-stained brain section with multiple lesions (arrowed) made along 2 recording tracks with quartz platinum/tungsten microelectrodes. B, The ON/OFF ratios [log(SNRwhite/SNRblack)] of individual neurons (left) and their running averages (right) plotted versus V1 cortical depth. The running averages (from 9 neighboring cells) represent a smoothed version of the variation of ON/OFF ratio. C, Histograms of the ON/OFF ratios assigned to different layers of V1. D, The percentages of black-dominant (ON/OFF ratio <0) and white-dominant (ON/OFF ratio ≥0) neurons in different layers of V1. The responses to white and to black were based on results of sparse noise with reverse correlation.

