
Figure 1.
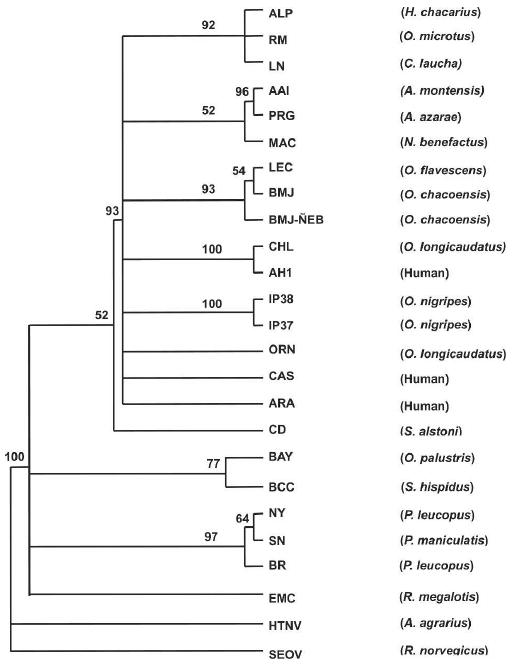
Phylogenetic tree based on maximum likelihood analysis of 438 and 575 nucleotides from G1 and G2, respectively. Nucleotide sequences were analyzed by maximum likelihood analysis of PAUP version 4 b10, using heuristic search option and weighting transversions four times transitions. Bootstrap values of > 50%, obtained from 1,000 replicates of the analysis, are shown at the appropriate branch points. See Table 1 for the definition of the abbreviations used to identify each sequence.