Figure 6.
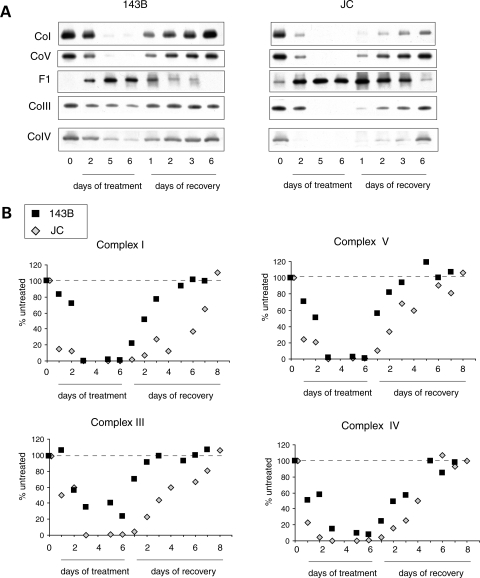
Assembly kinetics of RC complexes. (A) BN-PAGE of 143B (left) and JC (right) cells grown for 6 days in the presence of doxycicline followed by 6 days without the drug. Mitochondrial RC complexes were studied at different time points during the treatment and the recovery. Note that the JC blots are subjected to a longer exposure than 143B ones in order to obtain similar band intensities in the two lines. (B) Quantification of complexes I, III, IV and V band intensities in doxycline treated cells expressed as a percentage of the respective complexes from untreated cells (day 0). Each value is the average of two independent experiments.

