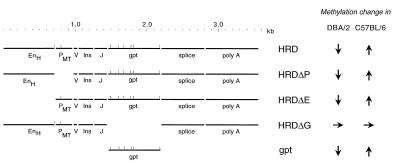
Figure 1.
Transgene maps and summary of methylation patterns in transgenic mice. EnH, mouse Ig heavy chain enhancer; PMT, mouse metallothionein-1 promoter; V, recombination recognition sequences from a mouse variable region κ gene; Ins, portion of the rat preproinsulin gene containing the initiation codon; J, recombination recognition sequences from a mouse κ joining region segment; gpt, xanthine–guanine phosphoribosyltransferase gene from E. coli; splice, splicing signals from simian virus 40 (SV40); polyA, polyadenylation signals from SV40. HpaII/MspI sites used for methylation analysis are indicated by vertical ticks above each map. Arrows indicate the trend of methylation (data summarized from Figs. 2 and 3).

