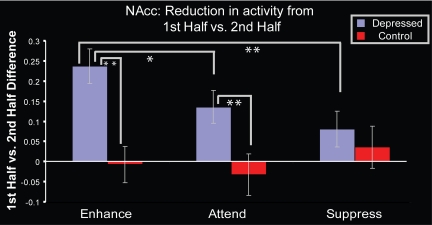
Fig. 3.
For depressed patients, the greatest decrease in NAcc activity across time occurs to the enhance condition. Greater values indicate a greater decrase in activation from first to second half. Across the three conditions, the Group × Condition interaction was significant [F(2, 42) = 5.01; P = 0.01]; the MDD group also showed a significant linear trend across conditions [F(1, 76) = 6.77; P = 0.01]; controls did not (F < 1). Pairwise t tests for the MDD group were significant in the Enhance vs. Attend [t(25) = 2.60; P = 0.015] and Enhance vs. Suppress [t(25) = 3.09; P = 0.005] contrasts, there were no significant pairwise contrasts for the controls. Significant group differences were also found in the Enhance [t (43) = −3.86; P < 0.001] and Attend [t(43) = −2.59; P = 0.01] conditions such that the MDD group showed a greater decrease in NAcc activity from first to second half than controls. Error bars indicate SEM. *, P < 0.05; **, P < 0.01.

