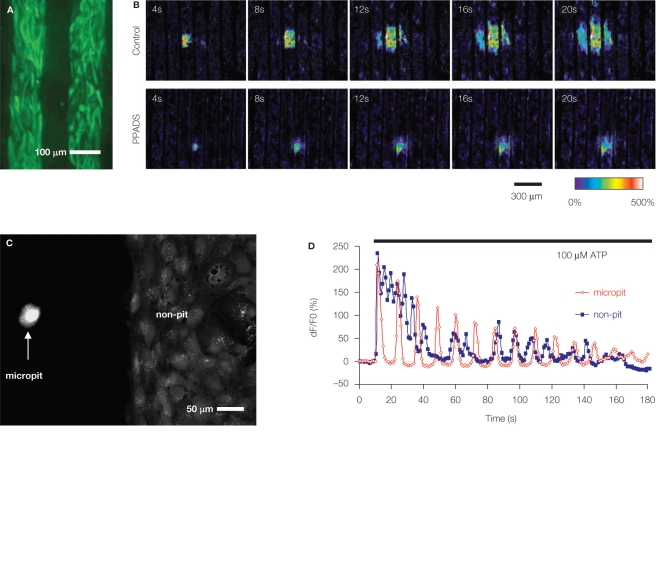
Figure 2.
Soft lithography micropatterned substrates and their use for investigation of astrocytic Ca2+ dynamics. (A,B) ATP-mediated intercellular Ca2+ waves (ICW) among astrocytes. (A) Astrocytes grown on a glass coverslips patterned with alternating stripes of poly-l-lysine and agarose. Astrocytes adhered to the permissive substrate poly-l-lysine as indicated by labeling using indirect immunocytochemistry and an antibody against the astrocytic marker glial fibrillary acidic protein (GFAP; green). (B) Astrocytes cultured on striped micropatterned substrate [note that agarose stripes are narrower than in (A)] can be used to investigate ICW. Mechanical stimulation of astrocytes within the primary stripe (the third stripe from left) caused intracellular Ca2+ elevation that spread within the stripe and to the adjacent stripes in form of ICW (Control), implicating an involvement of a diffusible factor, which is also consistent with the circular pattern of ICW. The main diffusible molecule released from stimulated astrocytes, which supports the spread of ICW, is ATP, since the purinergic receptor antagonist pyridoxal-phosphate-6-azophenyl-2′,4′-disulfonate (PPADS) in extracellular solution reduced the extent of ICW. Time elapsed from mechanical stimulation is indicated on individual images in seconds. Ca2+ dynamics were visualized using a Ca2+ indicator, which fluorescence changes are shown as dF/Fo (%) in pseudocolor. Modified from Takano et al. (2002). (C,D) Characteristics of astrocytic intracellular Ca2+ oscillations are affected by interactions among astrocytes. (C) A micropatterned coverslip that contains cell-adhesive substrate polyethyleneimine in a micropit (left) and a non-pit region (right) surrounded by agarose (dark). Solitary astrocytes can populate the micropit regions, while non-pit regions contain confluent astrocytes, as evident from labeling with the vital stain calcein. (D) Time-lapse sequence of astrocytic intracellular Ca2+ changes in response to stimulation with ATP (horizontal bar). The [Ca2+]i oscillations from a solitary astrocyte in the micropit show regular inter-peak intervals and dampening in amplitude (red trace). The intracellular Ca2+ response of a single cell within the group of confluent astrocytes in the non-micropit region displays an oscillatory pattern with various inter-peak intervals. The graphs represent a Ca2+ indicator fluorescence changes expressed as dF/Fo (%). Modified from Lee et al. (2008).

