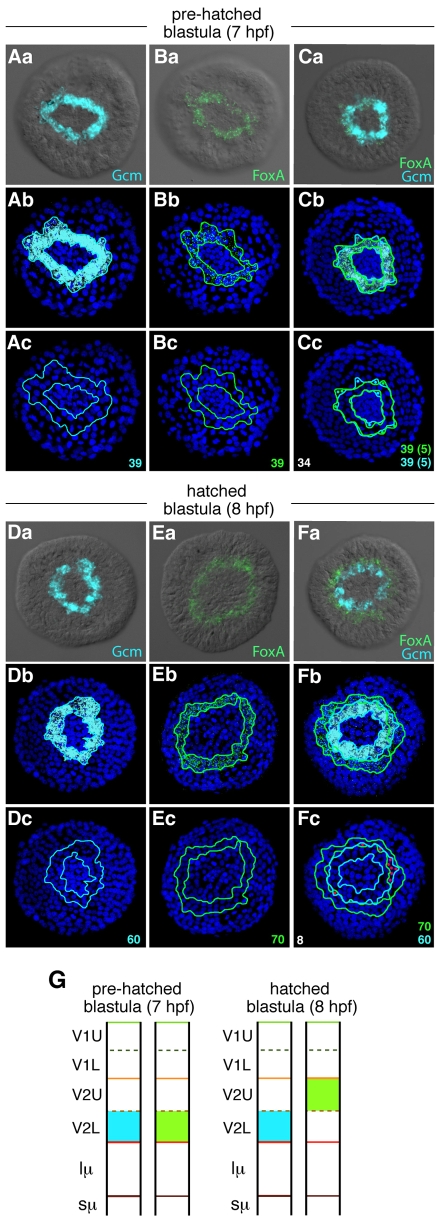
Fig. 2.
FoxA-Gcm relationship on a cell-to-cell basis over time. (Aa-Fc) Single (A,B,D,E) and double (C,F) fluorescent in situ hybridization analyses of Gcm and FoxA expression at pre-hatched blastula stage (7 hpf; A-C) and hatched blastula stage (8 hpf; D-F). For both stages, the first row shows two-channel fluorescence and DIC images of FoxA (light green) and Gcm (blue) expression either individually (Aa,Ba,Da,Ea) or together (Ca,Fa). The second and third rows show confocal projections of the first row embryos with blue-labeled nuclei. On the third rows, only the outlines of the expression domains of FoxA and Gcm have been kept to determine the average number of cells (numbers in the right corner) expressing each gene (Ac,Bc,Dc,Ec) or both genes (Cc,Fc). In Cc, dots reflect cells that express either FoxA or Gcm (average numbers in parentheses). In Fc, red dots highlight cells that express both genes, on average eight cells. (G) Summary of FoxA (light green) and Gcm (blue) expression profiles throughout time and in regard to cell lineage.

