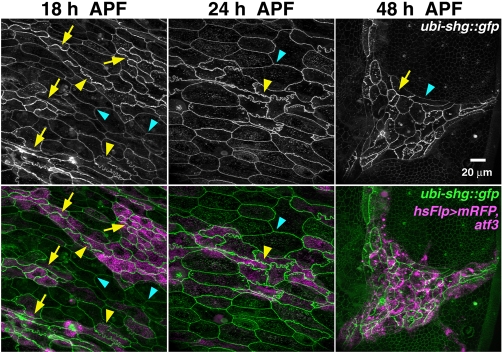
Fig. 6.
Behavior of LECs upon atf3 misexpression. Images of LECs with membranes marked by DE-cadherin::GFP (ubi-shg::gfp) were captured in live pupae at indicated times. Cells expressing mRFP (magenta, bottom row) were induced to express atf3 with the flp-out system. Compared with their uninduced neighbors, which have smooth membranes (blue arrowheads), the atf3-positive LECs show membrane interdigitation (yellow arrowheads) and enrichment of DE-cadherin (arrows) on apical junctions. By 48 hours APF only Atf3-positive LECs survive, being completely surrounded and apparently pressured by histoblasts. Note that junctions between atf3-expressing neighbors are thicker compared with their boundaries with uninduced LECs or with histoblasts. Images are z-stacks of confocal slices. Scale bar: 20 μm.

