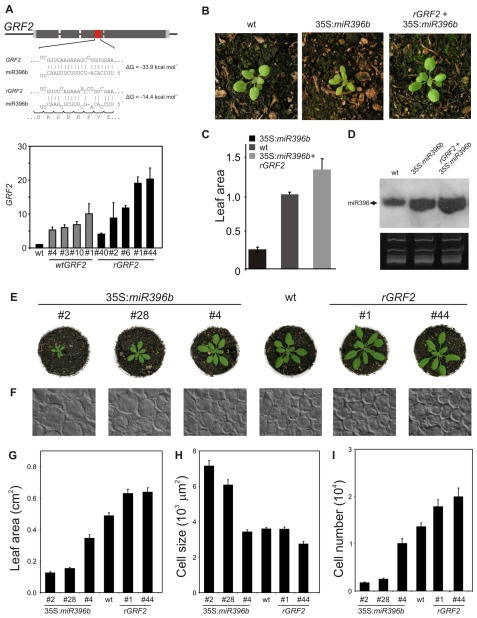
Fig. 5.
Regulation of leaf development by the balance between miR396 and the GRFs. (A) Diagram of rGRF2 indicating the synonymous mutations that alter the interaction with miR396. The graph below shows expression levels of GRF2 in seedlings with extra copies of a wild-type (GRF2) or miRNA-resistant (rGRF2) form of the transcription factor. The data shown are mean ± s.e.m. of three biological replicates. (B-D) Complementation of the miR396 overexpression phenotype by rGRF2. (B) Rosette phenotype of wild-type, 35S:miR396b and rGRF2 plants overexpressing miR396. (C) Leaf area determined for fully expanded first leaves of wild-type, 35S:miR396b and rGRF2+35S:miR396b plants. Values expressed relative to wild-type plants. (D) miR396 expression in wild-type, 35S:miR396b and rGRF2 plants overexpressing miR396. (E) Rosette phenotype of 18-day-old plants with different GRF levels. 35S:miR396b plants have reduced GRF levels, whereas rGRF2 plants have increased GRF levels. (F) Paradermal view of palisade cells in the subepidermal layer of leaf 1 of 20-day-old plants. (G-I) Leaf area (G), cell size (H) and palisade cell number (I) per leaf in wild-type, 35S:miR396b and rGRF2 transgenic plants. The data shown are the mean ± s.e.m. of eight leaves or 50 cells.

