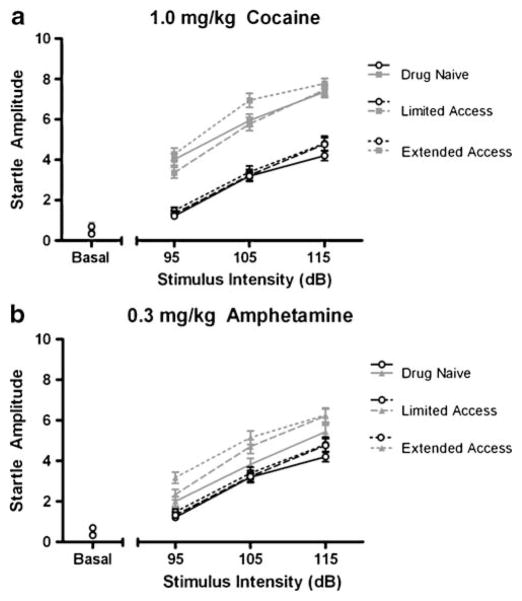
Fig. 5.
Average startle amplitude as a function of cocaine self-administration history (n=6). For each set of acoustic startle experiments (drug-naïve, limited access, and extended access), subjects were given either saline or drug immediately prior to the start of an experimental session. Graphs depict mean startle amplitude as a function of acoustic stimulus intensities (in decibels) at the midrange dose tested for cocaine (1.0 mg/kg) and amphetamine (0.3 mg/kg) for each set of startle experiments. Data are collapsed across repeated blocks of stimulus presentation. Open circles represent saline in both graphs

