
Figure 6.
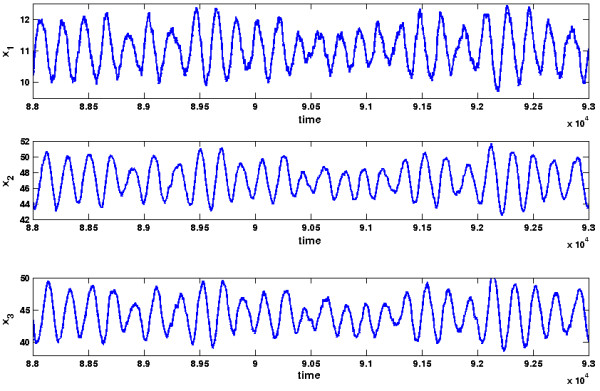
Oscillations of the MAP kinase signaling cascade. Plot of the oscillations of the MAP kinase signaling cascade. The plot is the result of a stochastic simulation via the Direct Gillespie approach with Dizzy.
Official websites use .gov
A
.gov website belongs to an official
government organization in the United States.
Secure .gov websites use HTTPS
A lock (
) or https:// means you've safely
connected to the .gov website. Share sensitive
information only on official, secure websites.
Oscillations of the MAP kinase signaling cascade. Plot of the oscillations of the MAP kinase signaling cascade. The plot is the result of a stochastic simulation via the Direct Gillespie approach with Dizzy.