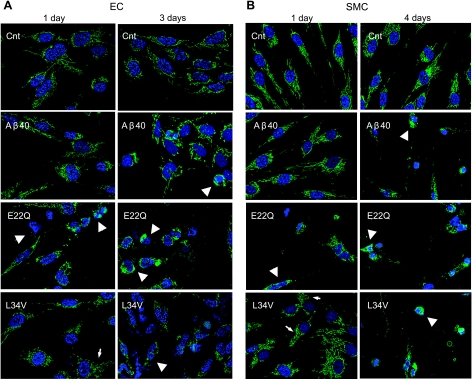
Figure 5.
Induction of CytC release by Aβ peptides. Immunocytochemical evaluation of CytC in ECs (A) and SMCs (B) treated with WT-Aβ40, E22Q, and L34V (50 μM) as described in Materials and Methods. Green fluorescence indicates CytC localization after immunostaining with the pertinent primary antibody followed by anti-mouse IgG conjugated with Alexa Fluor-488; blue fluorescence indicates nuclear DNA counterstained with DAPI. Arrows indicate CytC signal colocalizing with mitochondria showing early changes in organelle pattern, perinuclear distribution, and fragmented mitochondrial chains, typically preceding alterations in membrane permeability and subsequent release of CycC to the cytosol. Arrowheads indicate cells showing CytC cytosolic localization after release from mitochondria.

