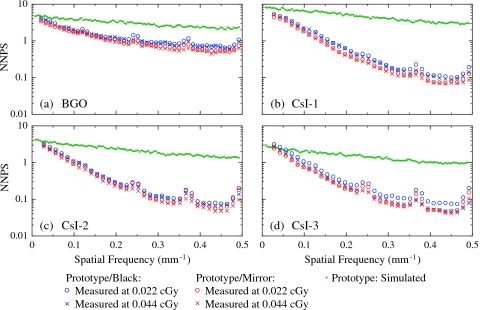
Figure 4.
NNPS for the (a) BGO, (b) CsI-1, (c) CsI-2, and (d) CsI-3 prototype EPIDs. The results are shown for configurations with the black top reflector (blue symbols) and the mirror top reflector (red symbols), at both 0.022 and 0.044 cGy. The maximum estimated error in the NPS results is ∼5%. The green dots correspond to simulated NNPS for the prototype EPIDs.

