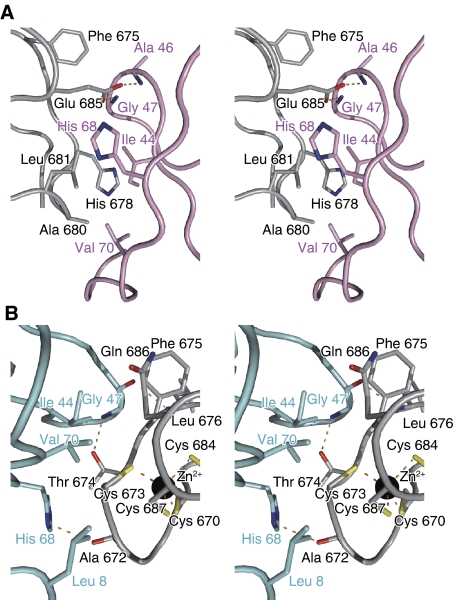
Figure 2.
Recognition of the distal and proximal ubiquitin moieties by TAB2. Stereo view of the detailed TAB2-NZF·K63-Ub2 binding interface. The colouring schemes are the same as in Figure 1. Hydrogen bonds are indicated as dashed orange lines. The labels of the NZF and the proximal and distal ubiquitin moieties are coloured black, pink and cyan, respectively. (A) The interface between the proximal ubiquitin and the TAB2-NZF. (B) The interface between the distal ubiquitin and the TAB2-NZF.

