
Figure 1. Comparative analysis of normal and Rho0 mitochondria.
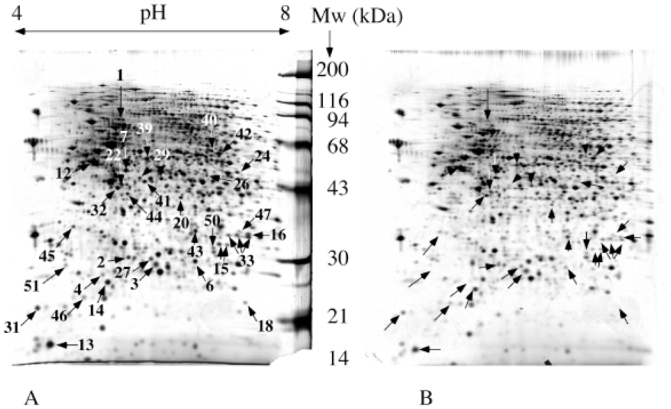
150 μg of mitochondrial proteins were separated by two-dimensional gel electrophoresis. Separation parameters: pH gradient: immobilized linear pH 4 to 8. Second dimension: 10% gel at pH 8.8 (glycine system). Detection by silver staining. Only reproducible differentially expressed spots are indicated by arrows and numbered according to table 1. This means in turn that some spots appear variable in the gel pair shown, but are not consistently variable. A: normal mitochondria. B: Rho0 mitochondria