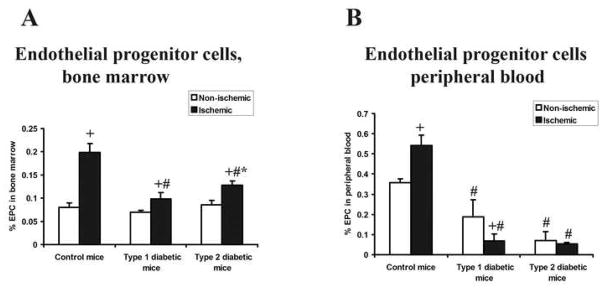
Figure 7. Percentage of EPCs in bone marrow and peripheral blood samples.
Peripheral blood and bone marrow (harvested from the femur and tibia of the non-ischemic or ischemic hindlimbs) was obtained 7 days after induction of ischemia. EPCs were characterized as CD34+, Flk-1+, CD133+ and cell quantitation was carried out by FACS analysis. m ± sd; n = 6 animals in each group; # P<.05 type 1 or type 2 diabetic mice vs. control mice; * P<.05 type 2 diabetic mice vs. type 1 diabetic mice, + P<.05 ischemic hindlimb vs. non-ischemic hindlimb.

