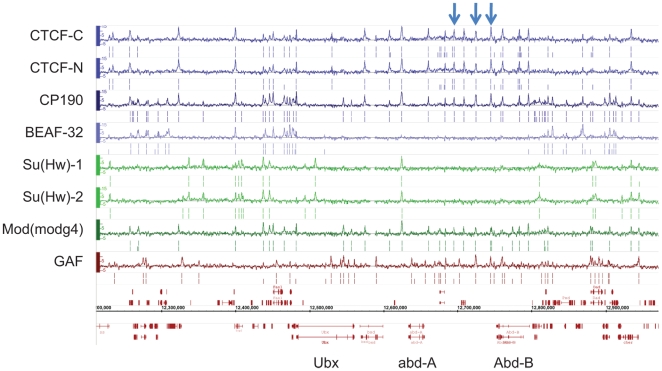
Figure 1. Binding profile of insulator-associated proteins in Drosophila.
Binding profile of the 6 proteins studied on a large region of the chromosome 3R including the Bithorax-Complex, which contains 3 well-characterized insulators (blue arrows). For each protein, the track depicts the MAT score of each probe plotted on the y-axis versus chromosomal position, plotted along the x-axis. Called binding sites at 1% and 5% FDR are marked below each track. Note CTCF-C/CTCF-N and Su(Hw)-1/Su(Hw)-2 represent data from 2 independent antibodies. Flybase annotated genes are represented in red as the two bottom tracks.

