
Figure 3. Group learning curves on average performance (top) and within-listener consistency (bottom).
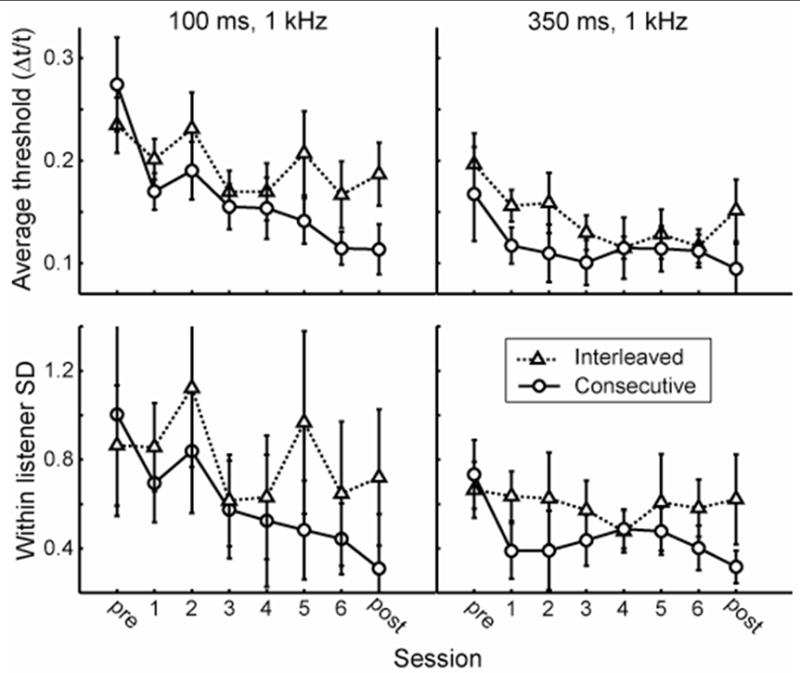
Results are shown for the interleaved (triangles) and consecutive (circles) groups for the 100-ms (left column) and the 350-ms (right column) conditions. For each listener, the two performance indices are defined as the mean (average performance) or standard deviation (within-listener consistency) of all threshold estimates completed for a particular condition during a single session. See Table 1 for the results of statistical analyses of these data.