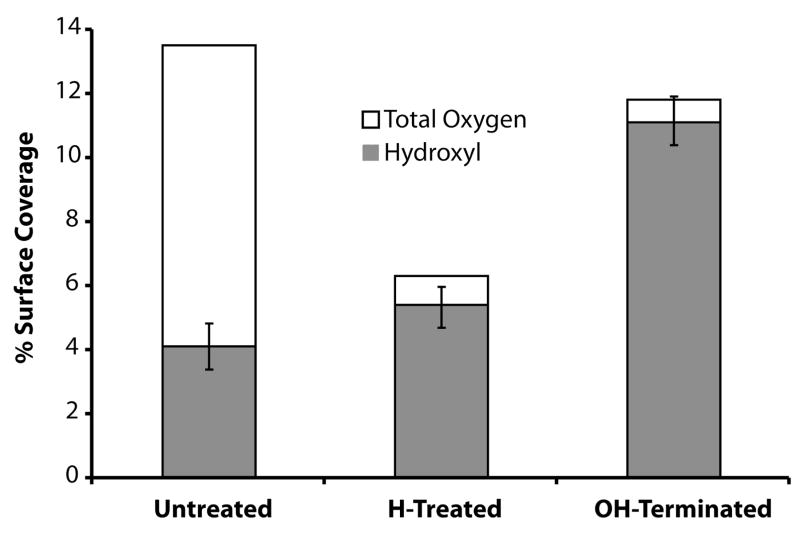
Figure 3.
Percentage of hydroxyl groups for untreated, hydrogen plasma treated, and hydroxyl terminated carbon-on-metal substrates. The surface concentration of hydroxyl groups was determined by reacting each substrate with TFAA, forming a trifluoroester on the surface. The shaded bars are the percentage of hydroxyl groups present on each substrate. The total height of each bar corresponds to the percent of oxygen present on each substrate, while the unshaded regions correspond to the percentage of oxygen that is not a hydroxyl group. The error bars were left off the percent total oxygen to simplify the figure and can be found within the text.

