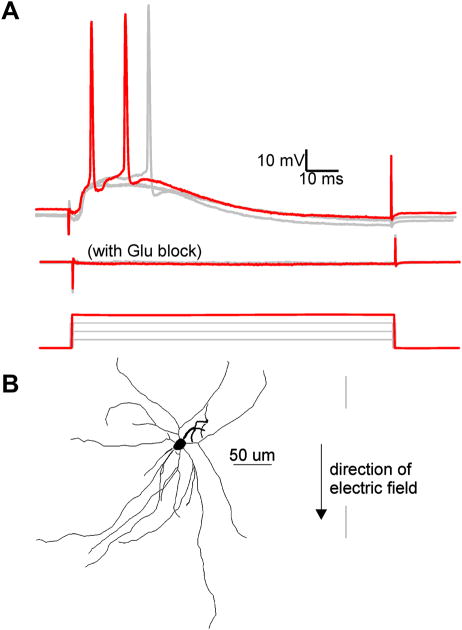
Figure 7.
Electric field induced EPSPs are reduced by bath application of CNQX and APV. A, Overlay of the response to electric field steps of increasing intensity. Top: Recorded intracellular voltage response to electric field steps of 51, 57, 63, and 70 (red trace) mV/mm. Note 63 and 70 mV/mm electric field steps induced action potentials. Middle: Voltage response to the same field intensities after 15 minute bath application of 20 μM CNQX and 50 μM APV. Bottom: Applied electric field waveforms. B, Tracing of L5 fast-spiking interneuron described in A.

