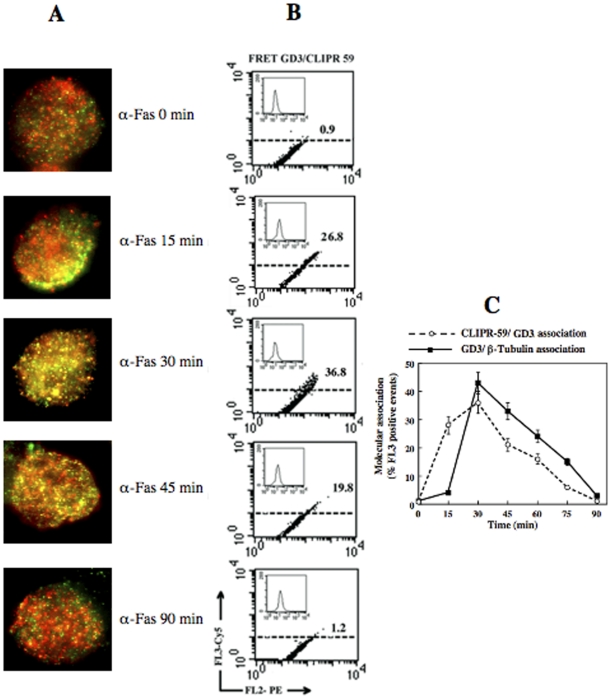
Figure 2. Static and flow cytometric analyses of GD3/CLIPR-59 association.
(A) Immunofluorescence analysis after double staining of GD3 (red) and CLIPR-59 (green) in untreated CEM cells and after treatment with anti-CD95/Fas (only merge pictures are shown). Note GD3/CLIPR-59 co-localization (yellow staining) at different time points (starting from 15 min) and the absence of any co-localization 90 min after anti-CD95/Fas treatment (bottom panel). (B) Quantitative evaluation of GD3/CLIPR-59 association by FRET technique, as revealed by flow cytometry analysis. This association was negligible in untreated CEM cells, started after 15 min after anti-CD95/Fas administration, reached its peak 30 min later and dropped down 90 min after treatment. Numbers represent the FRET efficiency indicating the GD3/CLIPR-59 association. Results obtained in one experiment representative of four are shown. Inset: flow cytometry analysis of CLIPR-59 expression at different times of anti-CD95/Fas treatment. (C) Time course analysis of the association GD3/CLIPR-59 compared with GD3/β-Tubulin association in CEM cells after anti-CD95/Fas administration. Note the different trend of the two curves, i.e. the earlier association of GD3/CLIPR-59 with respect to GD3/β-Tubulin association.

