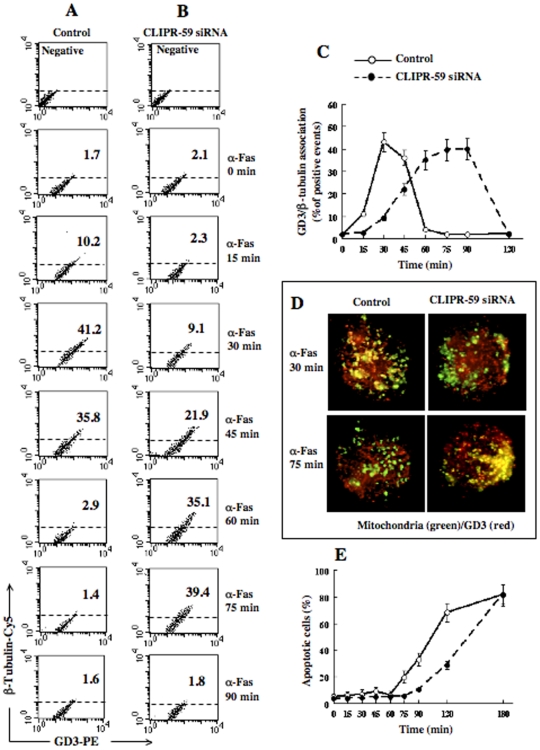
Figure 5. Effect of CLIPR-59 siRNA on GD3/β-Tubulin association and apoptosis.
(A–B) Time-course cytometric analysis of GD3/β-Tubulin association by FRET technique in control non-silenced cells (A) and in CLIPR-59 siRNA treated cells (B). Numbers represent the percentage of cells in which GD3/β-Tubulin association occurred. Results obtained in one experiment representative of three are shown. Note that FRET from acceptor to donor (indicating molecular association): i) reached its peak 30 min after anti-CD95/Fas administration in control cells and 75 min after CD95/Fas triggering in CLIPR-59 silenced cells and ii) dropped down 60 min after anti-CD95/Fas treatment in control cells and 90 min in CLIPR-59 siRNA treated cells. (C) Comparative time course analysis of GD3/β−Τ ubulin association (by FRET analysis) in control and CLIPR-59 siRNA treated cells. (D) Immunofluorescence analysis after double staining of GD3 (red) and mitochondria (green) in control and CLIPR-59 siRNA treated cells 30 and 75 min after treatment with anti-CD95/Fas (only merge pictures are shown). Note that GD3/mitochondria co-localization (yellow staining) was detectable at different time points after CD95/Fas treatment. (E) Comparative time course analysis of apoptosis (by evaluating the hypodiploid peak). Results are reported as mean values from three independent experiments±SD. Note the “delay” of both apoptosis and GD3/β-tubulin association induced by CLIPR-59 silencing by siRNA.

