FIGURE 3.
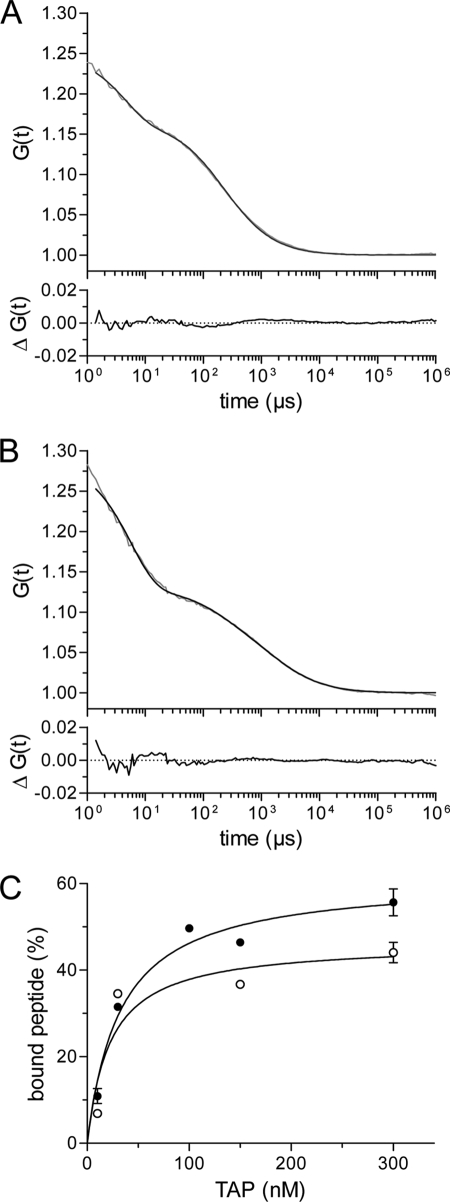
Peptide-binding affinity determined by fluorescence correlation spectroscopy. A, fluorescence auto-correlation of free peptide. Auto-correlation data (gray line) obtained for Alexa-633-peptide RRYCKSTEL (2.5 nm) were fitted by a one-component fit (Equation 3, black line) taking a fraction of the triplet state into account (τtriplet = 4.4 μs). A diffusion time (τfree) of 200 μs resulted from the fit. B, fluorescence auto-correlation of TAP-bound peptides. 2.5 nm of the Alexa-633-peptide RRYCKSTEL was incubated with 320 nm of solubilized and purified TAP for 30 min at 4 °C. The fluorescence correlation spectroscopy measurements were performed at 22 °C. Auto-correlation data (gray line) were fitted by a two-component model assuming fractions of free and bound peptides (Equation 3, black line) taking a fraction of the triplet state into account (τtriplet = 5.7 μs). The diffusion time for free peptide (τfree) was fixed to 200 μs, resulting in a diffusion time of bound peptide (τbound) of 1953 μs. The lower graph displays the residuals of the fit. C, Alexa-488- or Alexa-633-peptides RRYCKSTEL (2.5 nm of each) were incubated with increasing concentrations of TAP. Auto-correlation curves were fitted by a two-component model assuming fractions of free and bound peptides. The fraction of bound peptide (%) was plotted against the TAP concentration and fitted by a Langmuir (1:1) isotherm. For the Alexa-488 peptide, and the Alexa-633 peptide a KD of 20 ± 9 nm (open circles) and 30 ± 6 nm (closed circles) was deduced, respectively.

