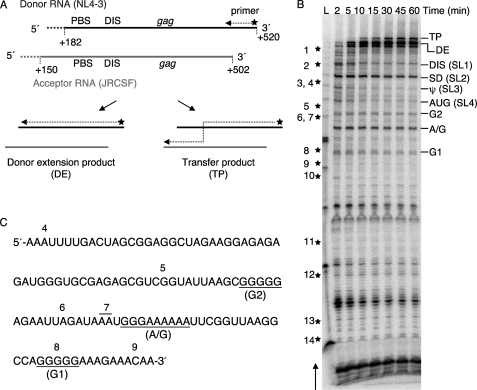
FIGURE 1.
A series of regularly spaced pauses correlates with runs of G or A/G residues in the strand transfer assay in vitro. A, shown is a schematic of the WT RNA templates. Bold lines represent the NL4-3 donor RNA (black) and JRCSF acceptor RNA (gray), whereas the hatched lines at the 5′-ends of both RNA templates represent plasmid-derived sequences. Relevant regions and nucleotide positions in the genomic RNA corresponding to the donor and acceptor RNAs are indicated. 32P-Labeled DNA primer (indicated by the star and arrow) was initially annealed to and extended on the donor RNA. Full-length synthesis on the donor RNA resulted in the donor extension product (DE), whereas template switching resulted in the transfer product (TP). PBS, primer binding site. B, shown is a strand transfer assay using WT templates. Reactions were terminated at 2, 5, 10, 15, 30, 45, and 60 min. The transfer product (385 nt), donor extension (353 nt), and major pause sites are indicated on the right side of the gel, whereas stars along with the numbers on the left indicate approximate marker positions in the newly synthesized DNA. The arrow on the left side of the gel indicates the direction of DNA synthesis. Lane L, 25-base DNA ladder. C, shown is the WT donor RNA sequence around the gag hot spot. Three G or A/G runs, which correspond to the regularly spaced pauses in gag hot spot, are underlined. The positions of markers are indicated on the top of the sequence.

