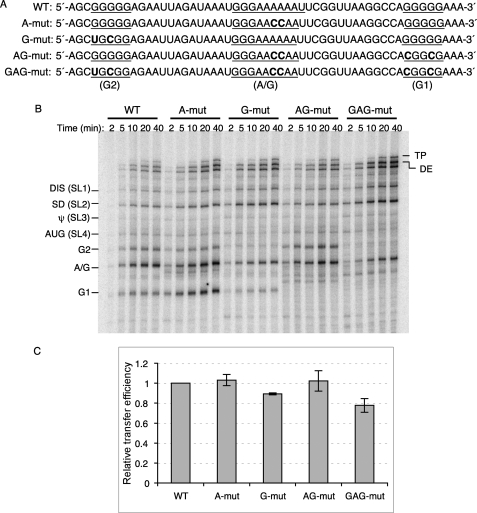
FIGURE 2.
Strand transfer assay using mutant templates. A, sequences of WT and mutant donor are shown. Base substitutions made to disrupt the three G or A/G runs (underlined) in the gag hot spot are indicated in bold. B, strand transfer assay using mutant templates are shown. Different donor RNAs are indicated on the top of the gel, and the acceptor RNA used in this assay is WT acceptor RNA. Reactions were terminated at 2, 5, 10, 20, and 40 min. Major pause sites are indicated on the left of the gel. DE, donor extension product; TP, transfer product. C, shown are relative transfer efficiencies of mutant templates. Transfer efficiency is calculated as: 100 × transfer products/(transfer products + full-length donor extension products). Relative transfer efficiency is calculated as: transfer efficiency of the mutant template/transfer efficiency of WT template.

