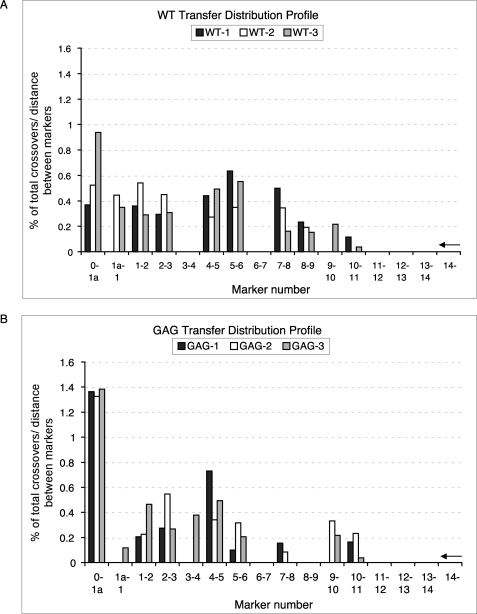
FIGURE 3.
Transfer profiles of WT (A) and GAG-mut (B) templates in vitro. The template descriptions are the same as in Fig. 2A. The x axis indicates the markers for the recombination events, numbered 1a–14. The y axis indicates the number of transfer events between markers divided by the total number of transfer events that occurred over the entire homology region, corrected for the number of bases between markers. Data collected from three independent experiments were indicated in black, white, and gray. The arrows on the right side of the charts indicate the direction of DNA synthesis.

