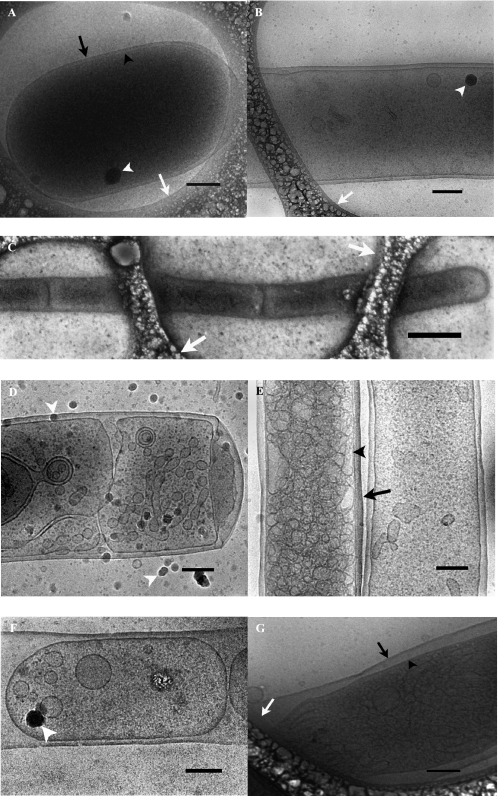
FIGURE 3.
Cryo-TEM analyses of whole E. coli cells. A and B, control strain BL21-AI without expression plasmid. C and D, samples from cells expressing wild-type alMGS. E and F, cells expressing wild-type alDGS. G, cells expressing inactive alMGS mutant E308A. A, normal sized E. coli filling up a hole in the polymer film. B, part of an elongated cell of the control strain. C, elongated E. coli-expressing alMGS cell with continuous outer membrane and several inner membrane compartments, stretching over several polymer holes. D, E. coli cell expressing alMGS with intracellular membrane structures, e.g. vesicles. E, elongated cell expressing alDGS filled with intracellular membrane vesicles next to an almost empty E. coli. F, part of an elongated E. coli expressing alDGS, where several inner membrane compartments with intracellular vesicles share the same outer membrane. G, E. coli cell expressing the alMGS E308A mutant, unable to synthesize glucolipid, filled with intracellular membrane vesicles. The black arrowheads indicate inner membranes of whole cells. The black arrows indicate outer membranes of whole cells. The white arrowheads exemplify the appearance of ice crystals deposited on the sample surface after vitrification, and the white arrows point to the polymer film present on the grid. Scale bars, 200 nm except in C where the scale bar indicates 1 μm.

