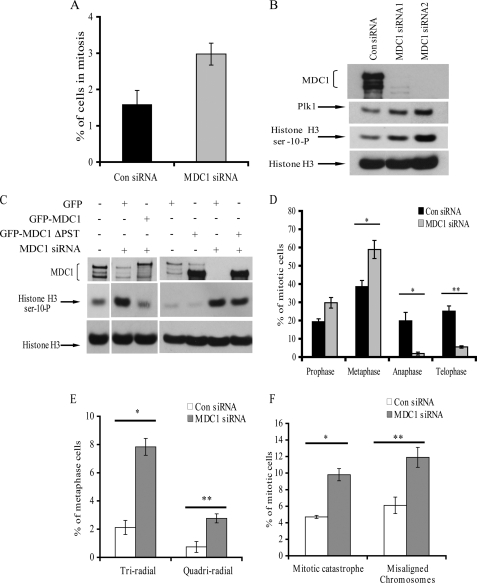
FIGURE 2.
Loss of hMDC1 causes a block in the metaphase-to-anaphase transition. A, depleting cells of hMDC1 increases the mitotic index. Cells were treated with either control or MDC1-specific siRNA, fixed, and subjected to FACS analysis using phosphohistone H3 serine 10 as a marker of mitotic cells. B, cells were treated with either control (Con) or one of two different MDC1-specific siRNAs. Extracts were subjected to SDS-PAGE, and phosphohistone H3 serine 10 was used as a marker of mitotic cells. Unphosphorylated histone H3 was used as a loading control. C, cells were treated with either control or MDC1-specific siRNA and transfected with the GFP vector alone, full-length GFP-MDC1, or GFP-MDC1 lacking the PST repeat domain. Extracts were subjected to SDS-PAGE, and phosphohistone H3 serine 10 was used as a marker of mitotic cells. Unphosphorylated histone H3 was used as a loading control. D, the distribution of mitotic stages in cells treated with control or hMDC1 siRNA was determined by microscopy. Different mitotic stages were differentiated by DAPI and α-tubulin staining. A minimum of 150 mitoses was counted for each siRNA. Three independent experiments were counted. *, p < 0.05; **, p < 0.005. E, loss of hMDC1 results in multiple mitotic abnormalities. Microscopy was used to score multiradial metaphases in cells treated with control or hMDC1-specific siRNA. Cells were stained with DAPI to visualize the DNA and with an anti-α-tubulin antibody to visualize the spindle. A minimum of 150 metaphases were counted for each siRNA. Three independent experiments were counted and are represented in the histogram. *, p < 0.00001; **, p < 0.004. F, mitotic catastrophes and lagging chromosomes were again determined, again using microscopy of cells treated with either control or hMDC1-targeted siRNA stained with both DAPI and an anti-α-tubulin antibody. A minimum of 150 mitoses were scored for each siRNA. Three independent experiments were counted and are represented in the histogram. *, p < 0.001; **, p < 0.01.

