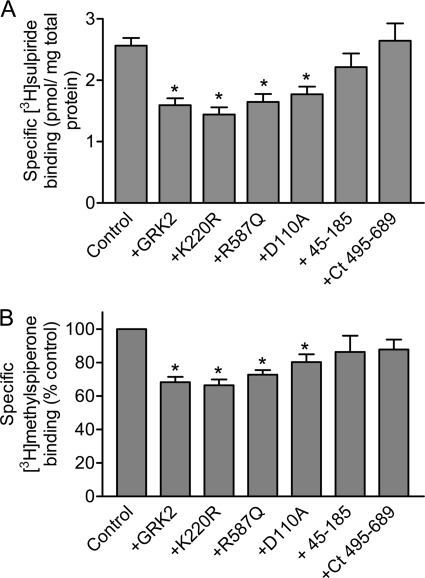
FIGURE 8.
Effect of GRK2 and its mutants on D2 DAR expression. HEK293T cells were transfected with the D2 DAR with pcDNA (Control), GRK2, GRK2-K220R, GRK2-R587Q, GRK2-D100A, GRK2-(45–185), or GRK2-(495–689) constructs. A, the cells were subjected to intact cell [3H]sulpiride binding assays as described under “Experimental Procedures.” The values shown represent the means ± S.E. from 3 to 11 independent experiments. *, p < 0.01, compared with control, unpaired Student's t test. B, total cellular D2 DAR expression was measured by [3H]methylspiperone (2 nm) binding as described under “Experimental Procedures.” Data are normalized to the control binding values for each individual experiment and expressed as means ± S.E. of 3–10 experiments. Statistical analyses were performed before normalization. *, p < 0.05, compared with pcDNA (Control), paired Student's t test. Ct, C-terminal.

