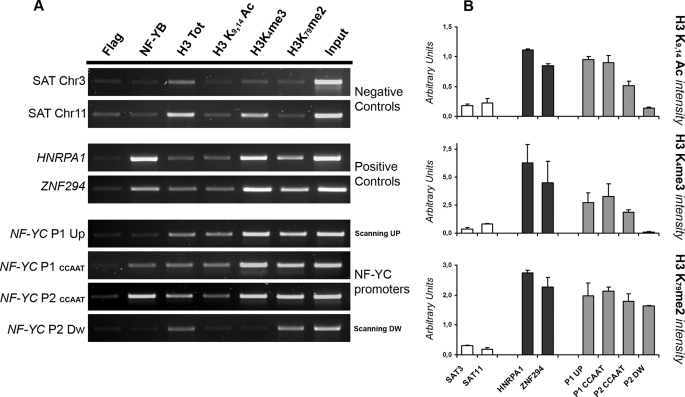
FIGURE 3.
Analysis of NF-YC promoters chromatin environment. A, ChIP analysis and semi-quantitative PCR were performed for the indicated promoters (on the left of each panel) in HCT116 cells, with anti-NF-YB, anti-H3, anti H3K9, K14Ac, anti-H3K4me3, and anti-H3K79me2 antibodies. The anti-FLAG antibody was used as a negative control. ChIP PCRs were performed in the linear range for each amplification products. B, data obtained with the semi-quantitative PCRs were quantified using the ImageJ software. Active histone marks intensity was scored against the level of total unmodified H3 and plotted as arbitrary units. Error bars refer to two independent PCR analyses.

