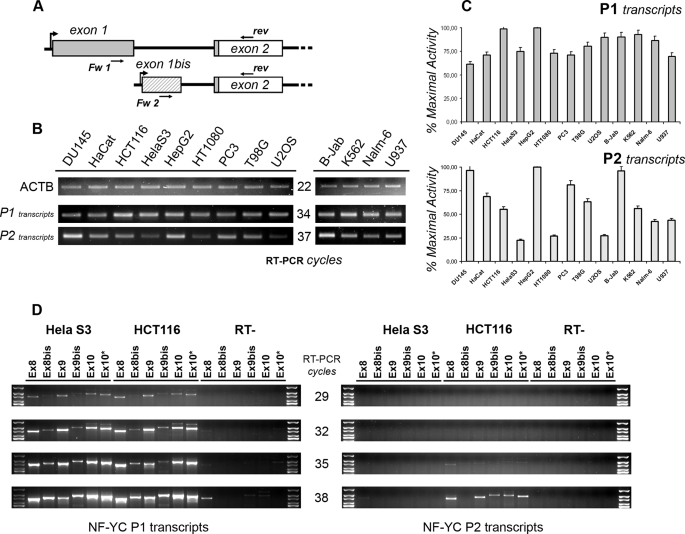
FIGURE 4.
NF-YC P2 is highly regulated and affects alternative splicing. A, scheme showing the structure of P1- (exon 1, gray) and P2 (exon 1bis, striped)-specific 5′UTR. The ATG is present at the beginning of exon 2, and the CDS is depicted in white. Primers used for “promoter” RT-PCR are also mapped. B, semi-quantitative RT-PCRs were performed to assess for P1 and P2 activity after normalizing the 13 human cDNAs for ACTAB content (upper panel). RT-PCRs were performed in the linear range of amplification; the number of cycles for each product is indicated in the middle. C, semi-quantitative RT-PCRs were quantified using the ImageJ software. The relative abundance of each transcript type was normalized versus the level of HepG2 cells. Error bars refer to two PCR cycles considered for the analysis. D, semi-quantitative RT-PCRs were performed with P1- (left plot) and P2 (right plot)-specific primers and a pool of reverse primers mapping within NF-YC Q-rich domain. RT-PCR cycles are indicated in the middle. Reverse primers identify the following NF-YC subtypes: Ex8 = total NF-YC; Ex 8bis = 50-kDa NF-YC; Ex9 = 37-kDa NF-YC; Ex9bis = 48-kDa NF-YC; Ex10 = 37 kDa + longer NF-YCs.

