FIGURE 2.
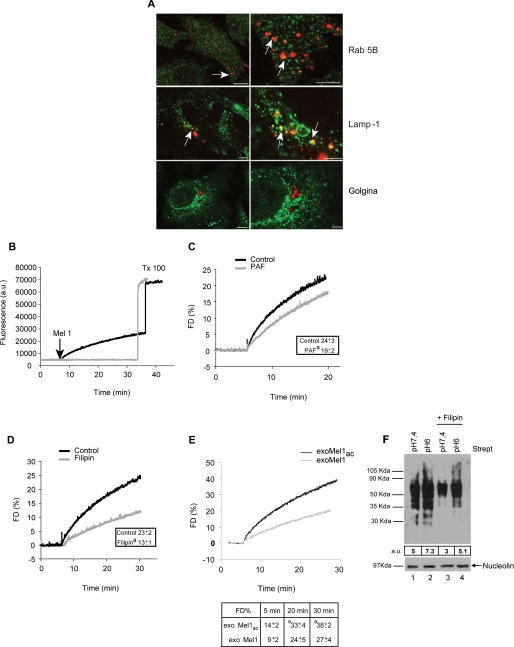
Exosome fusion with parental cells. A, a panel of confocal laser-scanning microscopy images of a human metastatic melanoma is shown. NHS-rhodamine-labeled exosomes (red) were incubated with cells for 4 h followed by fixation and labeling with green fluorescent antibodies directed to Rab 5B (early endosomes), Lamp-1 (lysosomes), and Golgina (Golgi apparatus). Arrows indicate the events of colocalization (yellow) in all samples, with the exception of Golgi compartment. Images in the right column represent magnification of the images on the left column. Bars: left panels, 10 μm; right panels, 4 μm. B, R18-exoMel1 were left untreated or mixed with 1 × 10⁶ Mel1 cells. Note that a fluorescence dequenching (FD) curve was observed only after the addition of the cells. Tx 100, Triton X-100. C, R18-exoMel1 were left untreated or pretreated with 0.5% PAF before the addition to Mel1 cells, and fusion activity was tested. A representative fluorescence dequenching curve is shown. Inset, statistical analysis obtained by 20 min of kinetic experiments is shown. Values are the means ± S.D. a = p < 0.05 versus control (n = 3). D, Mel1 cells (1 × 10⁶) were left untreated or treated with filipin, then subjected to a fusion test with R18-exoMel1. A representative fluorescence dequenching curve is shown. Inset, statistical analysis obtained by 30 min kinetic experiments is shown. Values are the means ± S.D. a = p < 0.01 versus control (n = 3). E, R18-exoMel1ac and R18-exoMel1 (10 μg) were mixed with parental cells at the corresponding pH, and fusion was monitored. A representative fluorescence dequenching curve is shown. Statistical analysis on 5-, 20-, and 30-min kinetic experiments is represented. Values are the means ± S.D. a, p < 0.05 (n = 3). F, streptavidin blotting is shown. 20 μg of biotinylated exosomes were incubated with parental cells (1 × 10⁶) at the corresponding pH (lane 1, exoMel1 on Mel1; lane 2, exoMel1ac on Mel1ac) or with filipin-treated cells (lane 3, exoMel1 on Mel1; lane 4, exoMel1ac on Mel1ac) for 1 h at 37 °C. Immunoblotting of nucleolin protein expression represents a control for protein equal loading. A representative Western blot of three independent experiments is shown. Numbers expressed in arbitrary units (a.u.) represent streptavidin densitometry analysis.

